Eocortex people traffic density heat map is a module which permits the owners of sales companies to achieve profitability and increase sales.
The module provides data on average traffic density in various areas of a store or shopping mall. This data allows user to see the most popular routes of customer movement, as well as the store windows in front of which they spend the most time. This information allows the owners to increase sales and revenue displaying the corresponding goods and placing the promotional content on these routes, as well as to increase rental rates and make substantiated offers for lease of the trading places in the areas of heaviest traffic to the suppliers, partners, and lessees.
People traffic density heat map is a reputable module with a long history. Its interface and tool kit has been updated in the version 2.4.
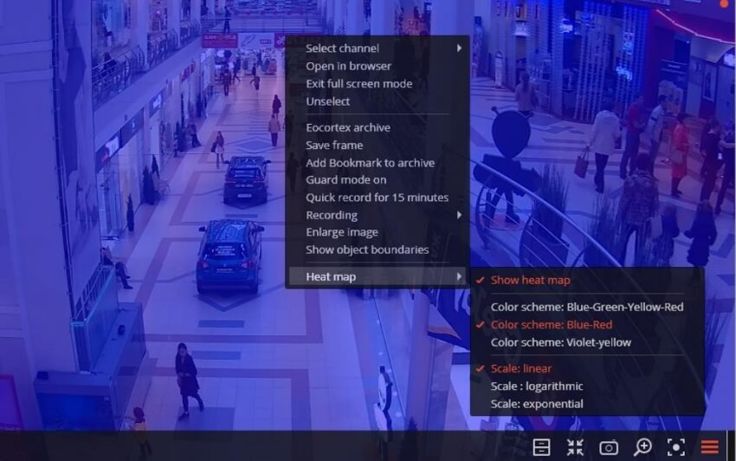
The module setup is very simple. It includes heat map real-time visualization parameters, and its assignment to a site plan (to facilitate subsequent analysis of the results).
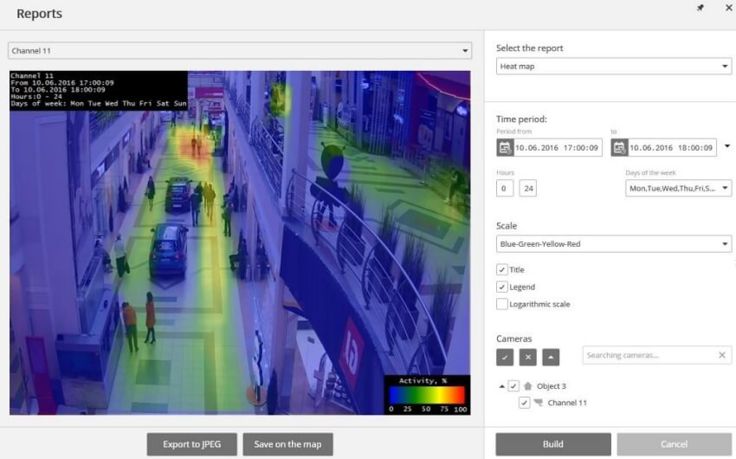
The color scale is used to visualize traffic density. The areas colored according to the traffic density are superimposed on the video image as a transparent layer. It is possible to choose one of the three color schemes for map visualization. The coldest color (starting with blue) represents the traffic with less density, the warmest (ending with red) – with more density.

It is also possible to set the scale: the linear one uniformly transfers density into color, whereas the logarithmic scale “increases” the lower density values and allows to better differentiate them. The exponential scale, on the contrary, “subdues” lower values thus allowing to better see the large ones.
The results can be obtained for any operation period of the module. They are presented as a graph report, where colored areas of the traffic density are superimposed over a frame. Also, the heat map can be displayed on a site plan.

Heat map allows to upgrade a video surveillance system from a “security system” to the “security and revenue increasing system”. Write to sales@eocortex.com and learn how to try out this module free of charge.